Putting things together
Every piece of information we learn is founded on something we have already learned before. Thus, layering information is critical. It is a tool you can use to guide your audience through a complex story. In data storytelling, we can achieve this by:
- Compounding builds in visualisation
- Sequencing different types of visualisations
- Drilling deeper into a single visualisaion
Putting things together
Do you know Dr Ignaz Semmelweis?
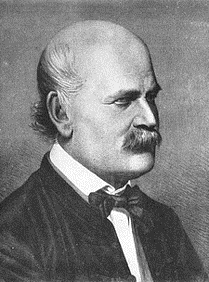
He was a medical doctor, who made a great discovery when he was working at Vienna Hospital. However, he did not communicate it well and had a sad ending of his career. A video below tells you in details together with lessons we can learn from him. He had a Wikipedia entry, too.
Lessons learnt from Dr Semmelweis story
- Timeliness and Clarity
- He did not publish for 14 years
- His findings were not well communicated
- Audience and the Curse of Knowledge
- His audience (Doctors) at the time were not used to being criticised
- Instead of concept sharing and patience, he went on the attack and threw insults at his critics
- Narrative Evokes Emotion
- Failed to tell the story of his data- did not humanize his patients but treated them as numbers
- Provided numbers instead of impact
- Power of Data Visualization
- Relied primarily on data tables
- Ignored the Visual effect of graphs
Activity - How would you tell Dr Semmelwise’s discovery?
If you were Dr Semmelweis, how would you storyboard your ideas and re-tell your story?
Things you may want to think are:
- What audience would you focus on?
- What angle would you use to appeal to your audience?
- What would be your call to action? - Not sure that I understand ‘call to action”
- Develop a brief flow of ideas about how you would most logically convey the story.
You are done!

That’s it folks! We hope you enjoy telling your story about your research with data :)