What is data storytelling?
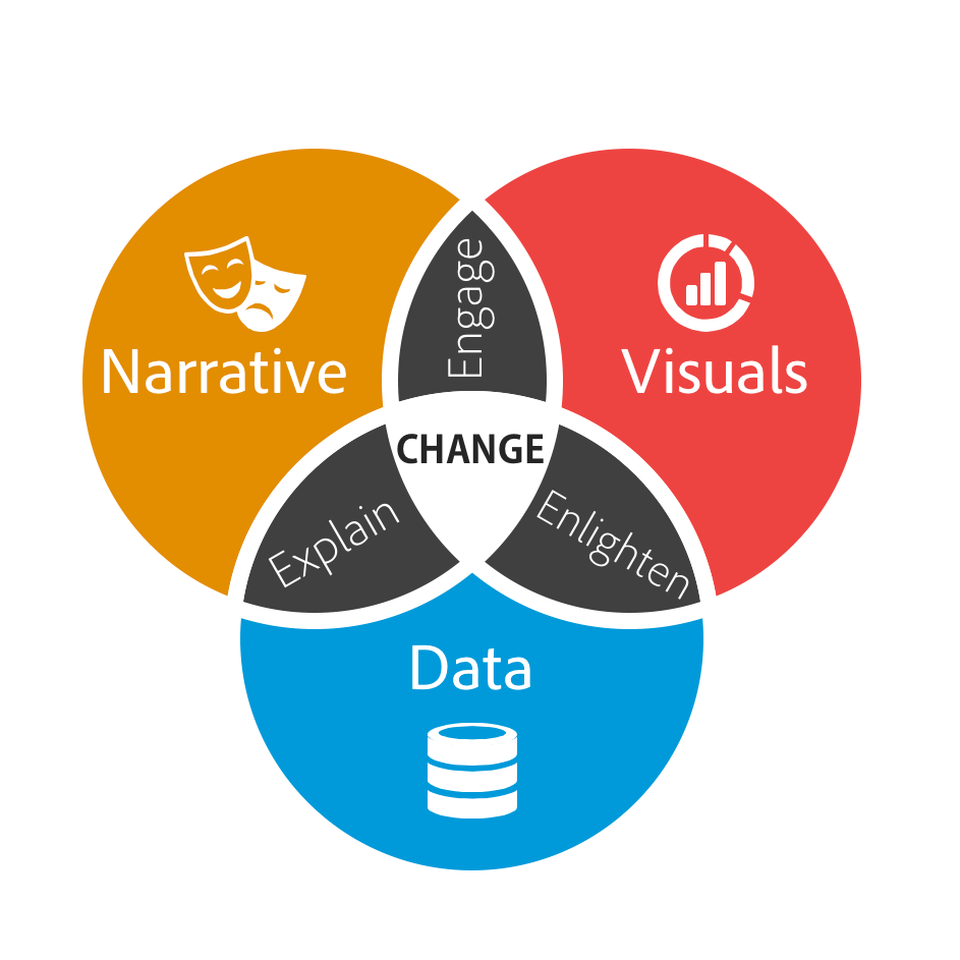
So, what is data storytelling? Data storytelling is a structured approach for communicating data insights, and involves a combination of three key elements: data, visuals and narrative. The combination of the three can help you explain, enlighten and engage your audience. Buildling a narrative around your data, can help you focus on what you really want to say.
- Because you have to get the actual message together before you can tell a story.
- It can help you articulate the impact of your story.
- It means you will be considering who your audience is and crafting a story or a message for them.
Data means nothing without context, without a story around it and using a narrative can provide context and direction. Stories are effective in communicating meaning locked in data.
From data to knowledge

If a story is brought together by your data, visuals and narratives- let’s start by looking at your data.
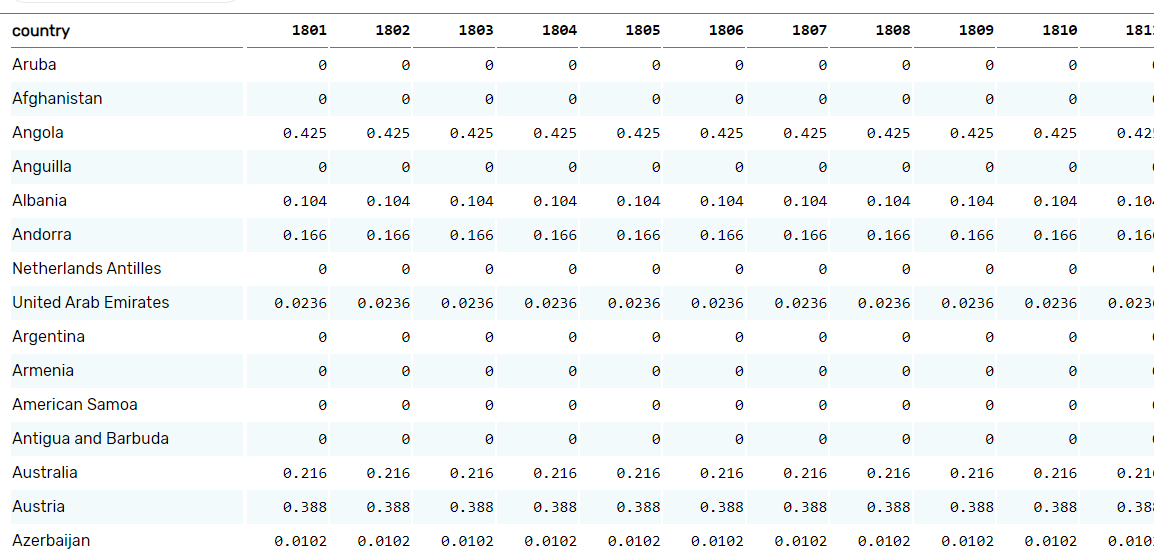
Data is the basis of your research, where you derive your insights.
Data starts off as numbers and letters but by exploring the relationships between your data, you create information.
This information is great, but you need to explain what this information means .. creating Knowledge.
This knowledge is what we want to share with people.
Activity - Gapminder
I want you to watch this 4 minutes’ Gapminder video and see how Hans Rosling’s narrative enhances your understanding about data presented with a visual.
Do you think you would feel the same excitement if he presented his finding in a data file, e.g., Microsoft Excel sheet?
Let’s start exploring how we can start telling a story from the next section.